PlatoForm: “Autonomous Formation of Platoons”
Details of the related research are published in:
L. Ghiro, R. Lo Cigno, E. Tonini, S. Fontana and M. Segata: “Can Platoons Form on Their Own?” in the Proc. of the 15th IEEE Vehicular Networking Conference (VNC), Kobe, Japan, 2024 [Preprint, Powerpoint, Poster]
Contacts
![]() Lorenzo Ghiro
Lorenzo Ghiro ![]() Michele Segata
Michele Segata ![]() Renato Lo Cigno
Renato Lo Cigno

Goal: Simulate the spontaneous formation of platoons by coordinating the merge-maneuvers among connected vehicles that, originally, travel independently from each other in a 3-lane Highway.
More Details
CODE for running the Simulations
To run the PlatoForm Simulations these 3 custom versions of SUMO, VEINS and PLEXE are required:
plexe-sumo/vnc2024-platoform SUMO (release 1.20) featured with an automatic lane-change model for platoons.
-
veins/vnc2024-platoform VEINS including features to:
- intercept/handle events related to removal of vehicles;
- subscriptions to InductionLoops and LaneArea Detectors.
- plexe/vnc2024-platoform PLEXE featuring the PlatoForm implementation and use-cases.
Demo Use-Cases aka “Simple Scenarios”
To run the 2 platoform Demo use-cases:
cd $PLEXE_DIR/examples/platoform
./run -u Cmdenv -c simple1 -r 0
./run -u Cmdenv -c simple2 -r 0
Demo 1
 This first demo shows a fast (purple) platoon approaching a slower one (red): thanks to the PlatofForm protocol the purple platoon is able to merge at the back of the red platoon. Under the hood, the red platoon is advertising the availability to form larger platoons, while the purple one accepts the advertisement and requests to join; finally all vehicles merge together into the red platoon.
Demo 2
 The second demo shows a fast platoon (purple) overcoming a slower one (red): in this second example the red platoon is not advertising and rather listens only to
 Advertisements sent by other connected-vehicles. The purple one is instead advertising; after some time the red platoon becomes able to engage with the red platoon and starts a PlatoForm session, eventually the two platoons merge together.
Processing/Plotting
cd $PLEXE_DIR/examples/platoform/analysis/simplecases
./autoRunAndPlot.sh
The autoRunAndPlot.sh script available under the $PLEXE_DIR/examples/platoform/analysis/simplecases folder will:
- Run the 2 demo simulations in background (No SUMO Gui)
- Extract data from simulation outputs
- Plot extracted data, generating 2 pdf files inside the
simplecasesfolder. The 2 plots show the evolution of the speed&acceleration of all platoon-vechiles over time during the two Demo maneuvers.
PlatoForm
The $PLEXE_DIR/examples/platoform folder contains the configuration for running many simulations of the PlatoForm protocol. Check out the Config platoform in the omnetpp.ini file.
PlatoForm Scenario
The experiments defined under the Config platoform share the common scenario illustrated here below:

- Traffic Injection Three independent Poisson Processes injects car at a configurable vehicle Arrival Rate $A_r \in [5, 10, 15, 20, 25, 30]$ [veh./min./lane]
- Penetration Rate Each Traffic Injector is able to generate either connected-vehicles (equipped with 802.11p radios, and able to run the Platoform protocol) or standard human-driven vehicles. A traffic injector generating a new car will create either a connected-vehicle, with probability equal to the Penetration Rate parameter $R \in [0.25, 0.5, 0.75, 1]$, or a standard human-driven vehicle with probability $1 - R$.
Check out the code: [Configuration of the Traffic module, PlatoformTrafficManager.ned, PlatoformTrafficInjectionProcess.cc]
Methodology and Metrics
 Explore the SUMO configuration files
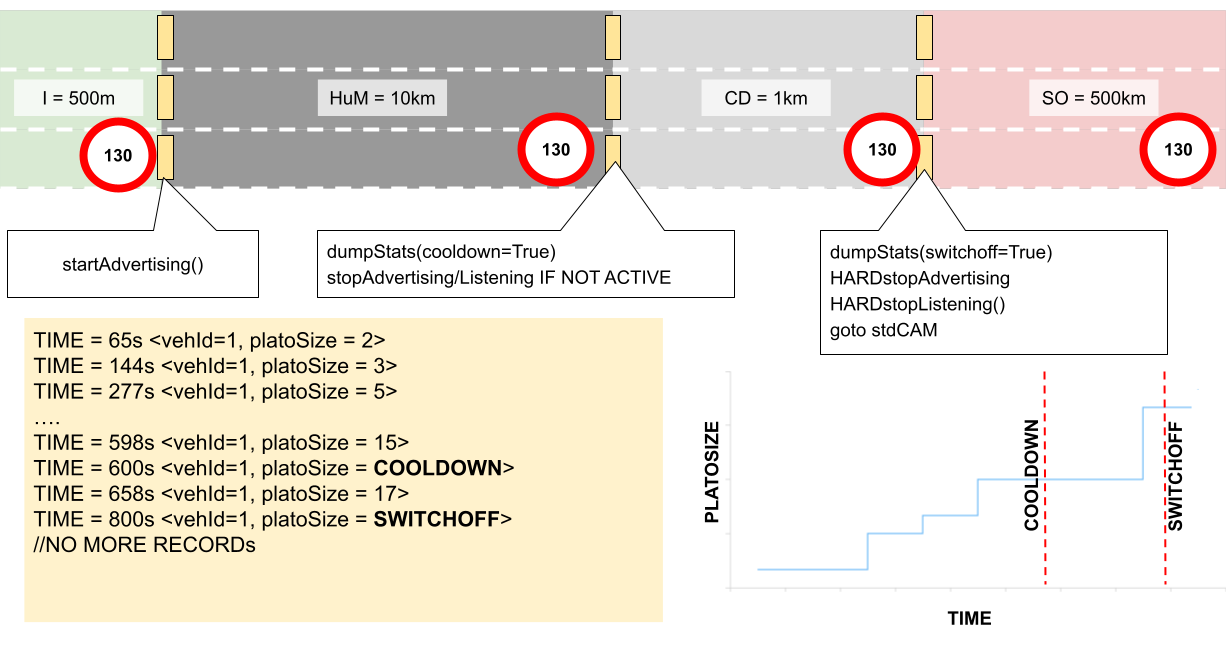
The SUMO Highway is a 3-lane Highways with a 130km/h speed limit. The Highway is divided in 4 sectors:
- Initial Sector (500m): The 3 Poisson Traffic Injectors are placed at the start of this Initial Sector. Connected cars are not allowed to use the radio in this sector and are also “lane-frozen”, i.e., they are not allowed to change lane. Check out the PFScenario.cc used to implement this behavior.
- Highway under Measure (10km): A 10km long stretch where connected vehicles (and eventually platoons) can take advantage of the PlatoForm protocol to merge together.
- Cool Down (1km): This sector begins at “the cooldown barriers” (as defined in the highway.add.xml). When a connected vehicle crosses a cooldown barrier it stops running the PlatoForm protocol unless currently engaged in an active session, in this latter case, the vehicle is allowed to complete this last session only. This behavior is implemented in PFScenario.cc, relying on the new VEINS’s feature of InductionLoop subscription.
- Switch Off (500m): Vehicles entering this sector switch off their radio, dump one concluding row in their log of statistics, and finally reach the end of the Highway where they vanish.
Main PlatoForm Paramters with links to relevant related code.
| Parameter | Value | |
|---|---|---|
| Road and Traffic | Num. of lanes | 3 |
| Road length | 10km of effective observation | |
| Observed vehicles | $> 1000$ | |
| $A_r$ | ${5, 10, 15, 20, 25, 30}$ veh./min./lane | |
| $V_i$ Desired speed | $s_i = U[100,105,110,115,120,125,130]$ km/h | |
| Platooning Penetration Rate $R$ | {0.25, 0.50, 0.75, 1.0} | |
| Communication | L2-technology | dual radio 802.11p |
| Tx power | 500 markdown | |
| Broadcast MCS | 3 Mbit/s | |
| Unicast MCS | 12 Mbit/s | |
| Rx sensitivity | -94 dBm | |
| PlatoForm Protocol | Dist_min | 20 m |
| Dist_max | ${50, 100, 150, 200 }$ m | |
| MaxPlatoonSize | {6, 8, 10, 25} | |
| Wait after Success / Abort | 5s / 20s | |
| Required Feasible Advertisements | 3 |
Data Processing
Before running any “analysis/plotting” script (most of them rely on python-matplotlib), data saved during simulation in the OMNeT++ format (.vec, .sca files) should be converted into Apache Parquet Format (.parquet).
For this purpose the user should rely on the Plexe Data Extraction scripts documented in the just linked Github repo but now shipped together with Plexe (in the bin folder).
Requirements
To runs what follows you may need to install:
- Apache Arrow C++ packages and Python Wheels
- arrow package for R
-
supplementary installation guide
R
# now you should be in an R console
source("https://raw.githubusercontent.com/apache/arrow/master/r/R/install-arrow.R")
install_arrow()
Data extraction and conversion to parquet
cd $PLEXE_DIR/examples/platoform/analysis
genmakefile.py parse-config > Makefile

make platoform.parquet -j $(nproc)
make pfoperation.parquet -j $(nproc)
If the above work as expected 2 files, namely, platoform.parquet and pfoperation.parquet should become available into the cd $PLEXE_DIR/examples/platoform/results folder. If so, it’s a good idea to move them into a new folder called data, located here: cd $PLEXE_DIR/examples/platoform/analysis/data Most of the analysis script rely on this folder structure assumption!
TROUBLESHOOTING:
- The Makefile starts by indexing OMNeT vector files creating vci files. Sometimes vci files are already created during simulations but are wrong and must be deleted:
rm ../results/*.vciThen run again the data-extraction instructions.
- Results (vec, vci and other related outputs) of simulations that contain errors (simulation ended because of a car collision etc.) should be manually removed from the results folder before running the extraction/conversion process.
Metrics
PlatoonRatio ($\eta$) at gates across space
Within the platoatgates folder run the script figetagates.sh
cd $PLEXE_DIR/examples/platoform/analysis/platoatgates
./figetagates.sh
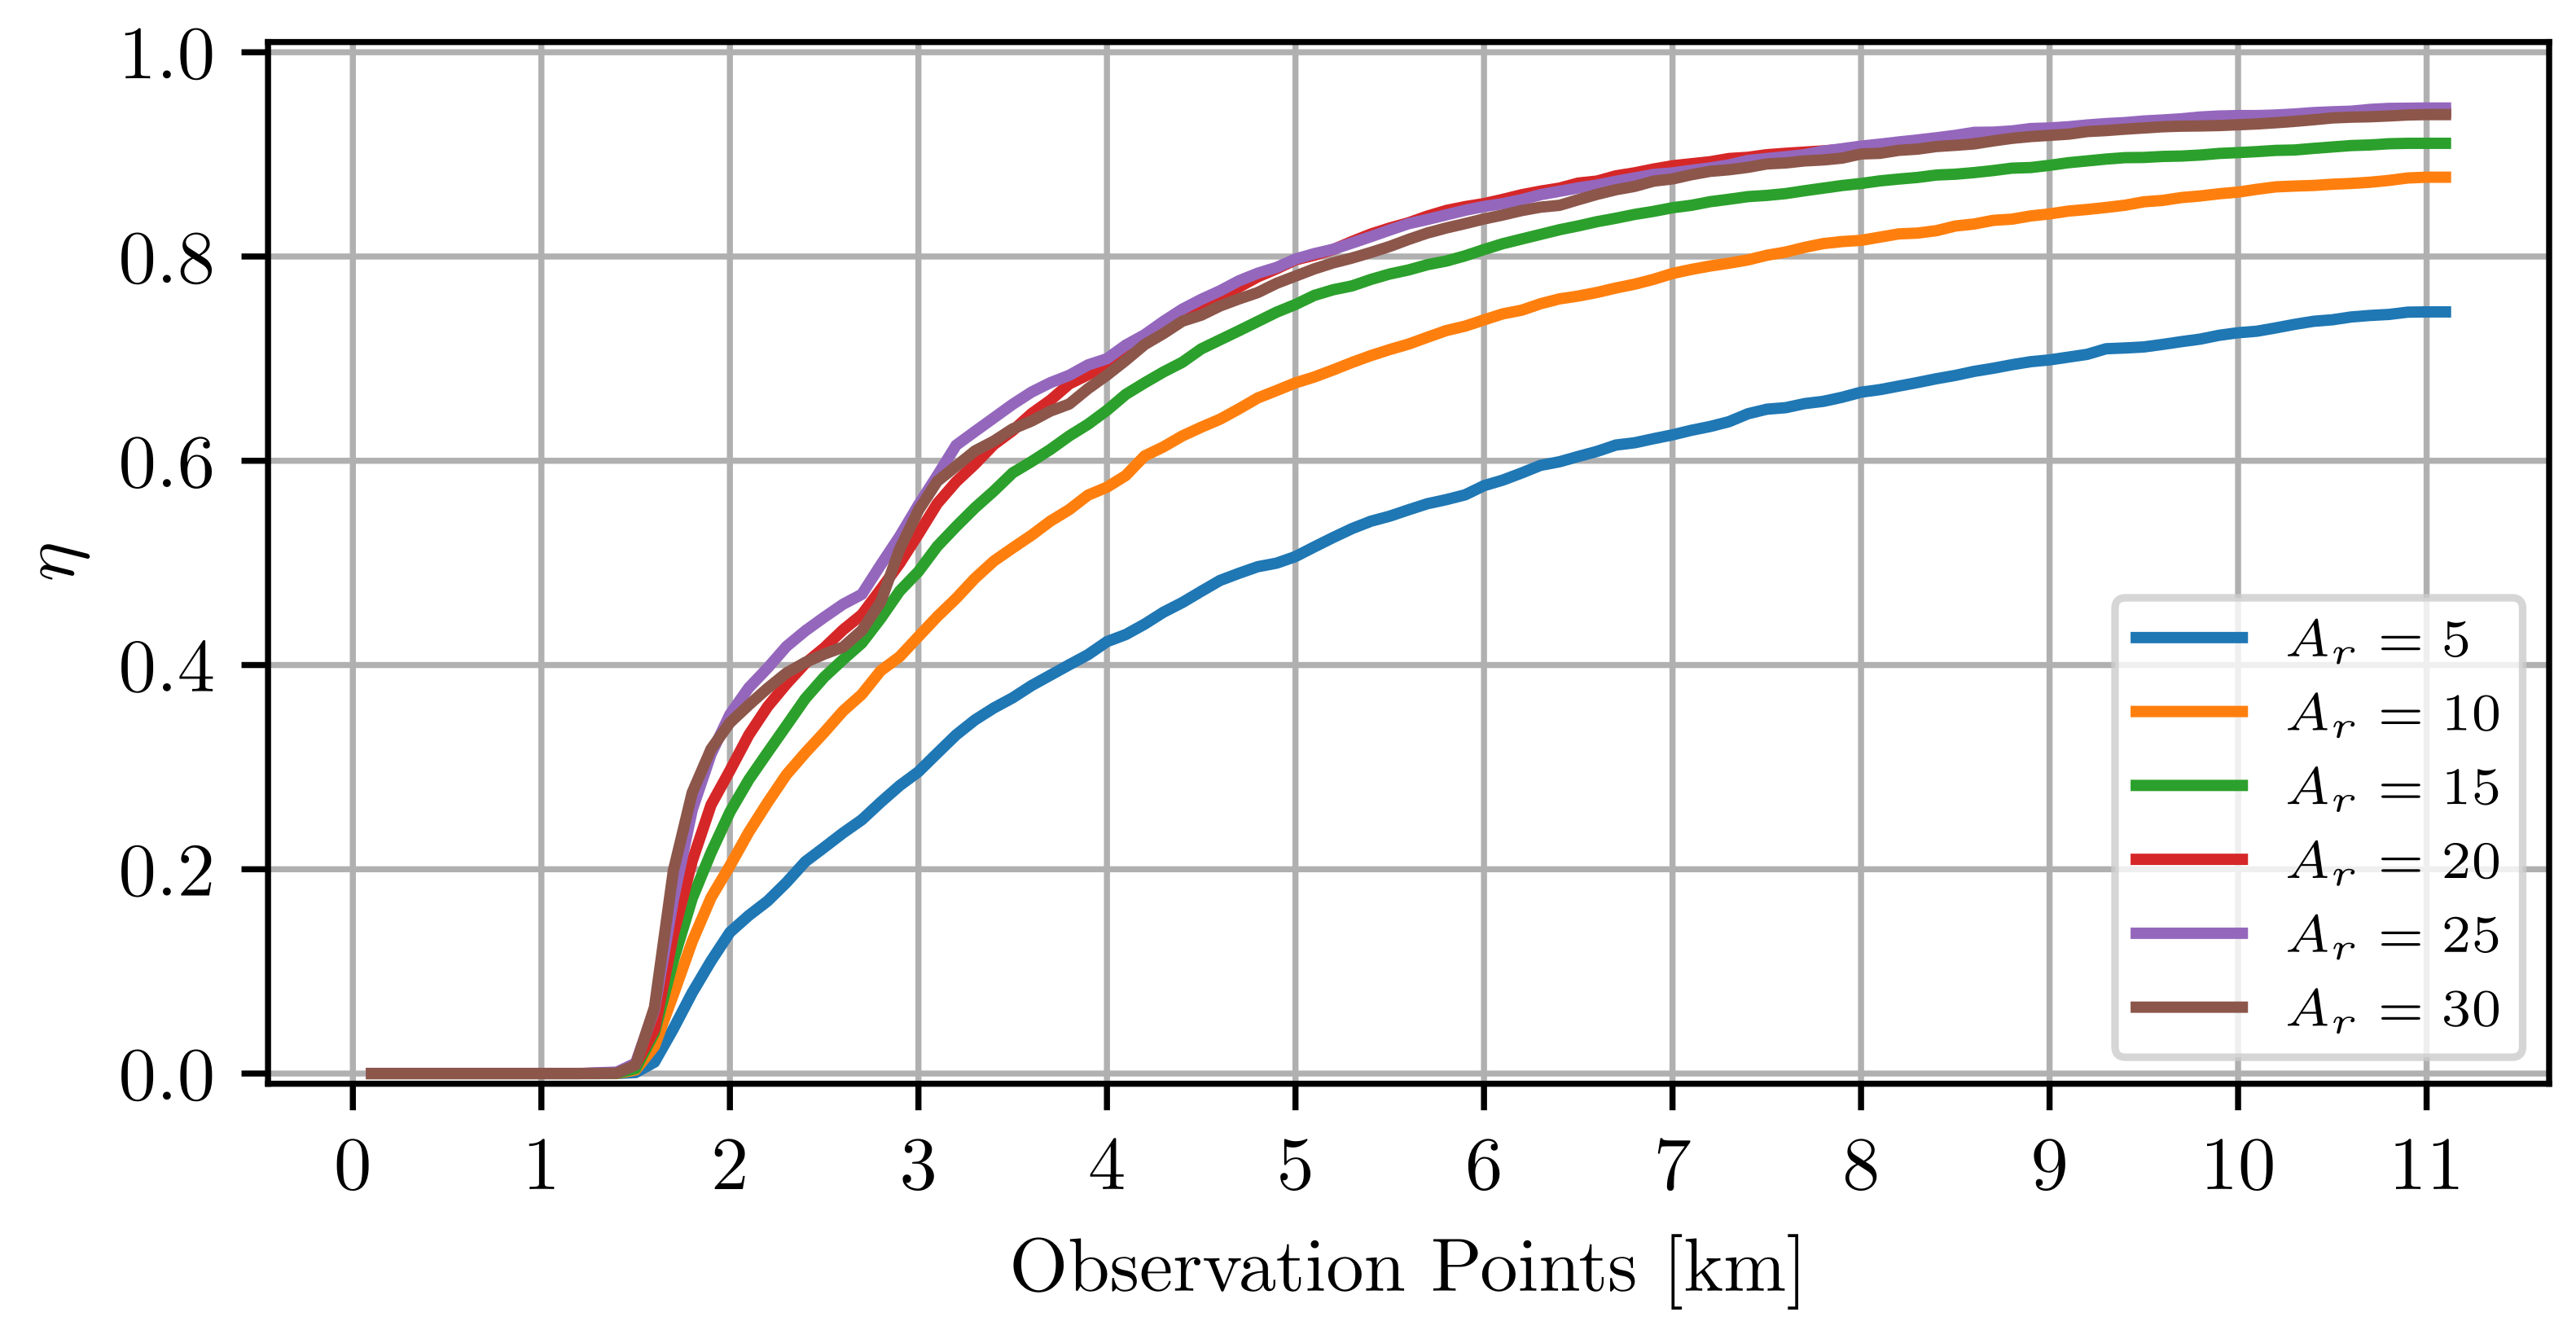
The script will load some data from the preprocessed data folder and generate various plots showing the evolution of the PlatoonRatio ($\eta$) over the 10km space where vehicles are allowed to run the Platoform protocol.
 $\eta$ over space: An example of results for various Arrival Rates ($A_r$). In the present case platoons where limited to a maximum size of 8 cars, the maximum distance between two merging platoon leaders was set to 50m and the Penetration Rate $R$ was 1.
Analysis of Platoforom Sessions Raw Data about PlatoForm sessions across various different simulations shuold be summarized into a pfoperation.parquet file as described here
To process the data collected in this file run the pfopanalysis.py script available in the analysis/pfsessions folder, e.g.:
python3 pfopanalysis.py ../data/pfoperation.parquet
This will generate pfopsummary.parquet that should be provided as input to plotting scripts. For example, run the followings:
python3 plotpfop.py pfopsummary.parquet
python3 plotpfopDURATION.py pfopsummary.parquet
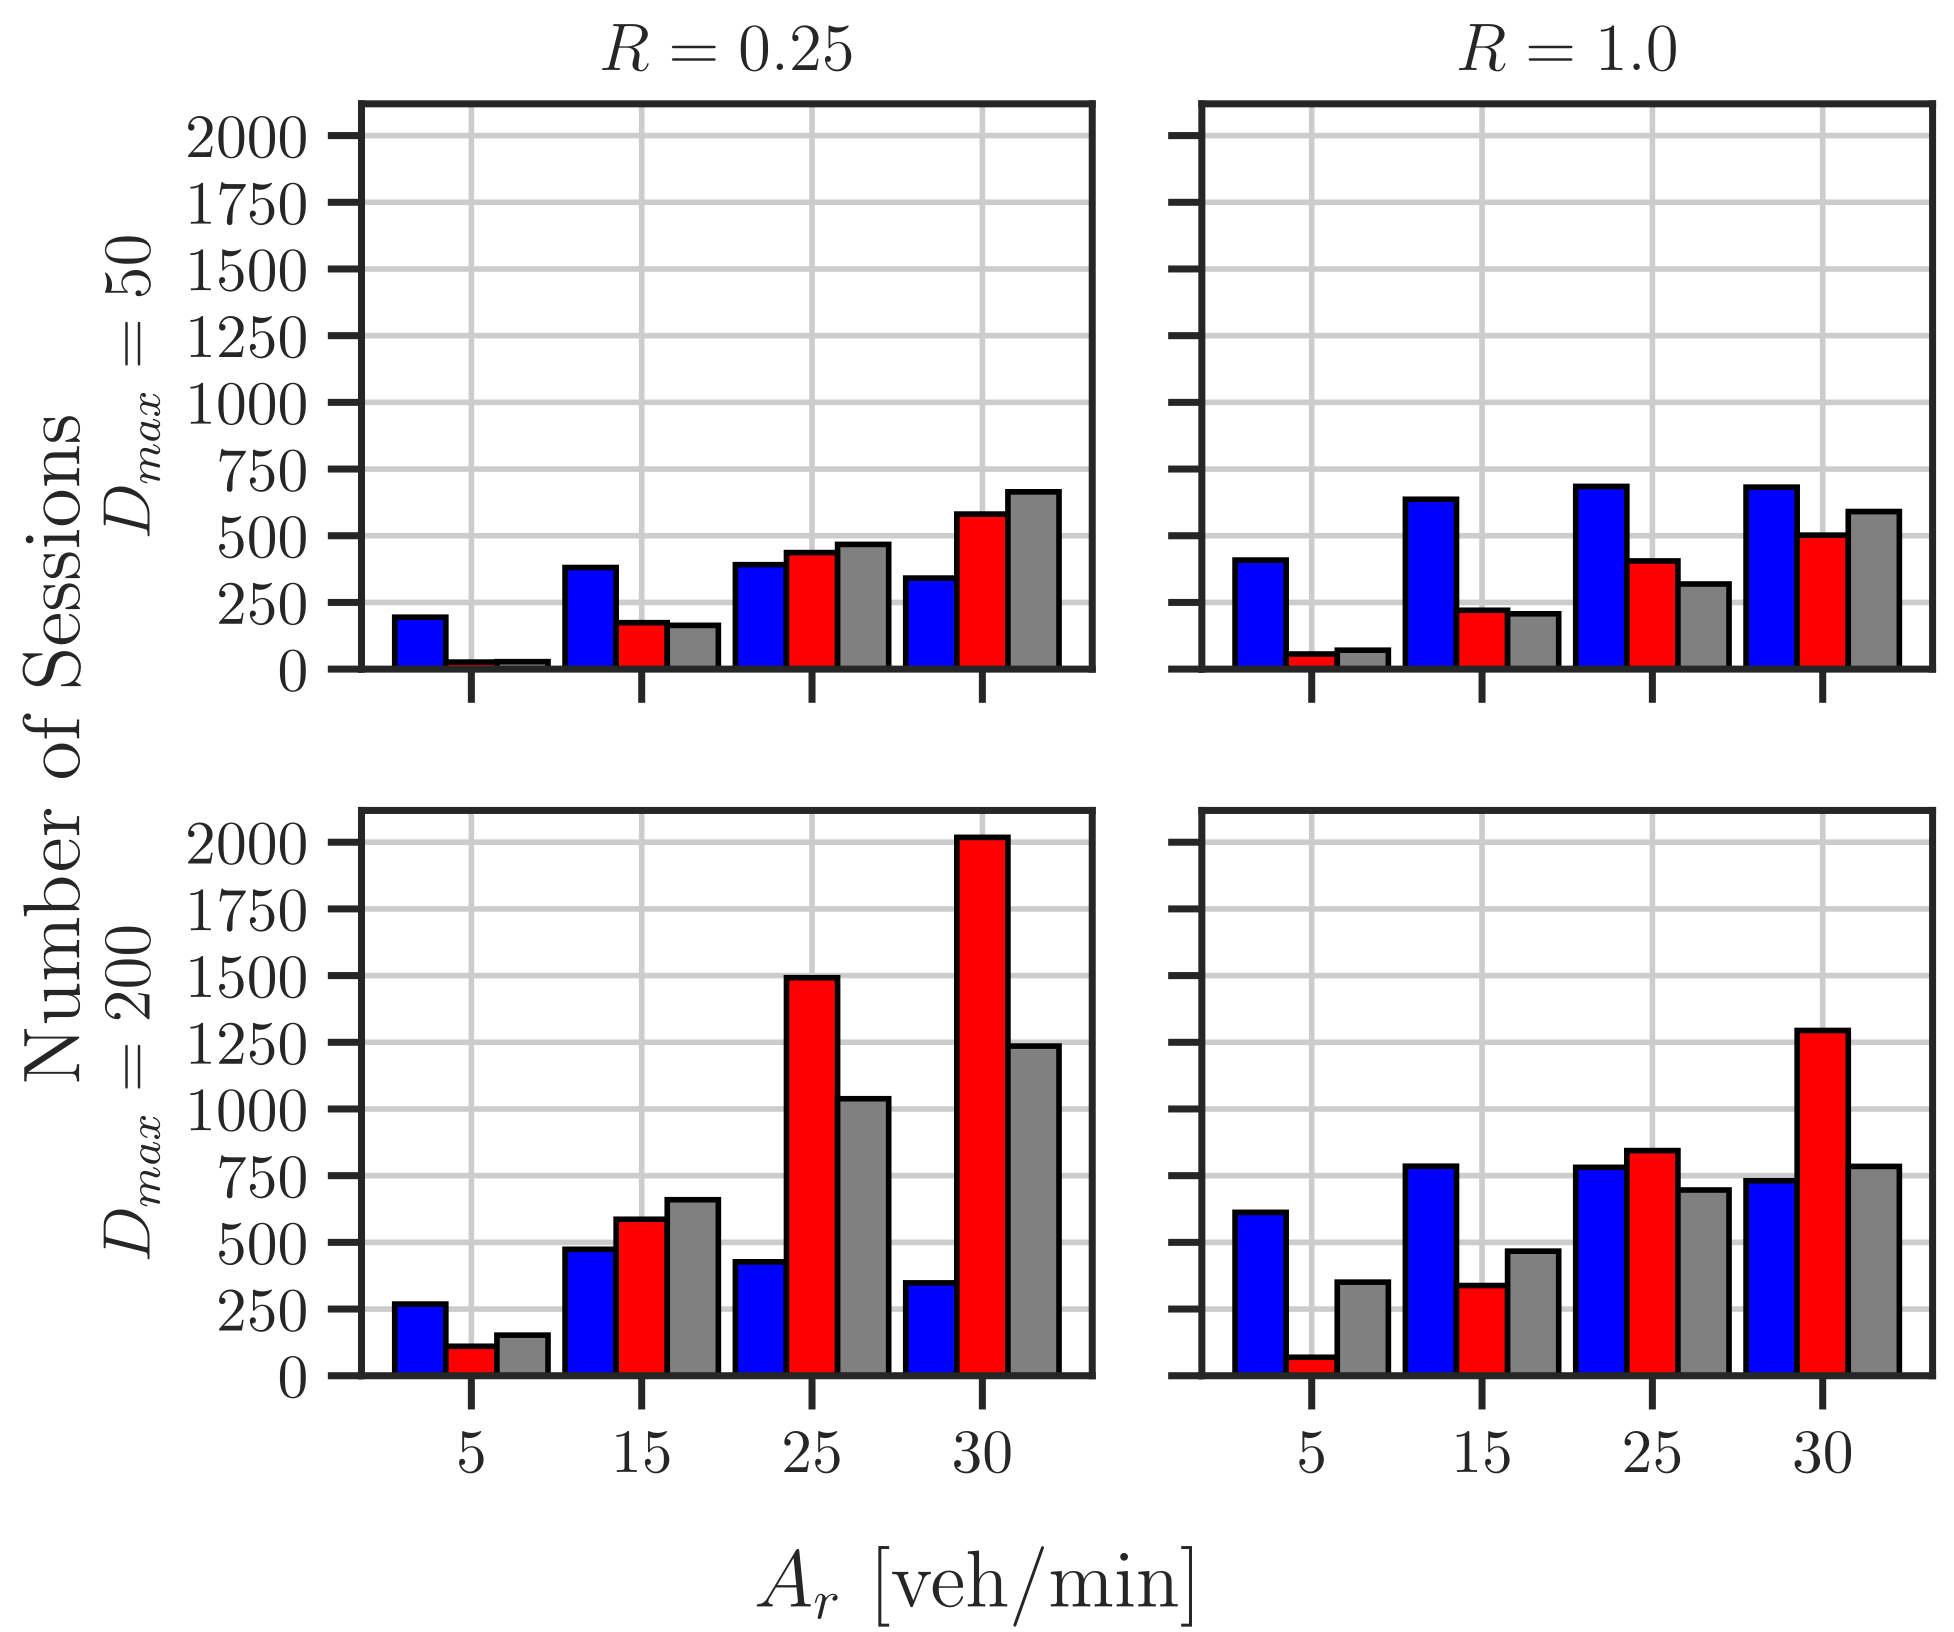
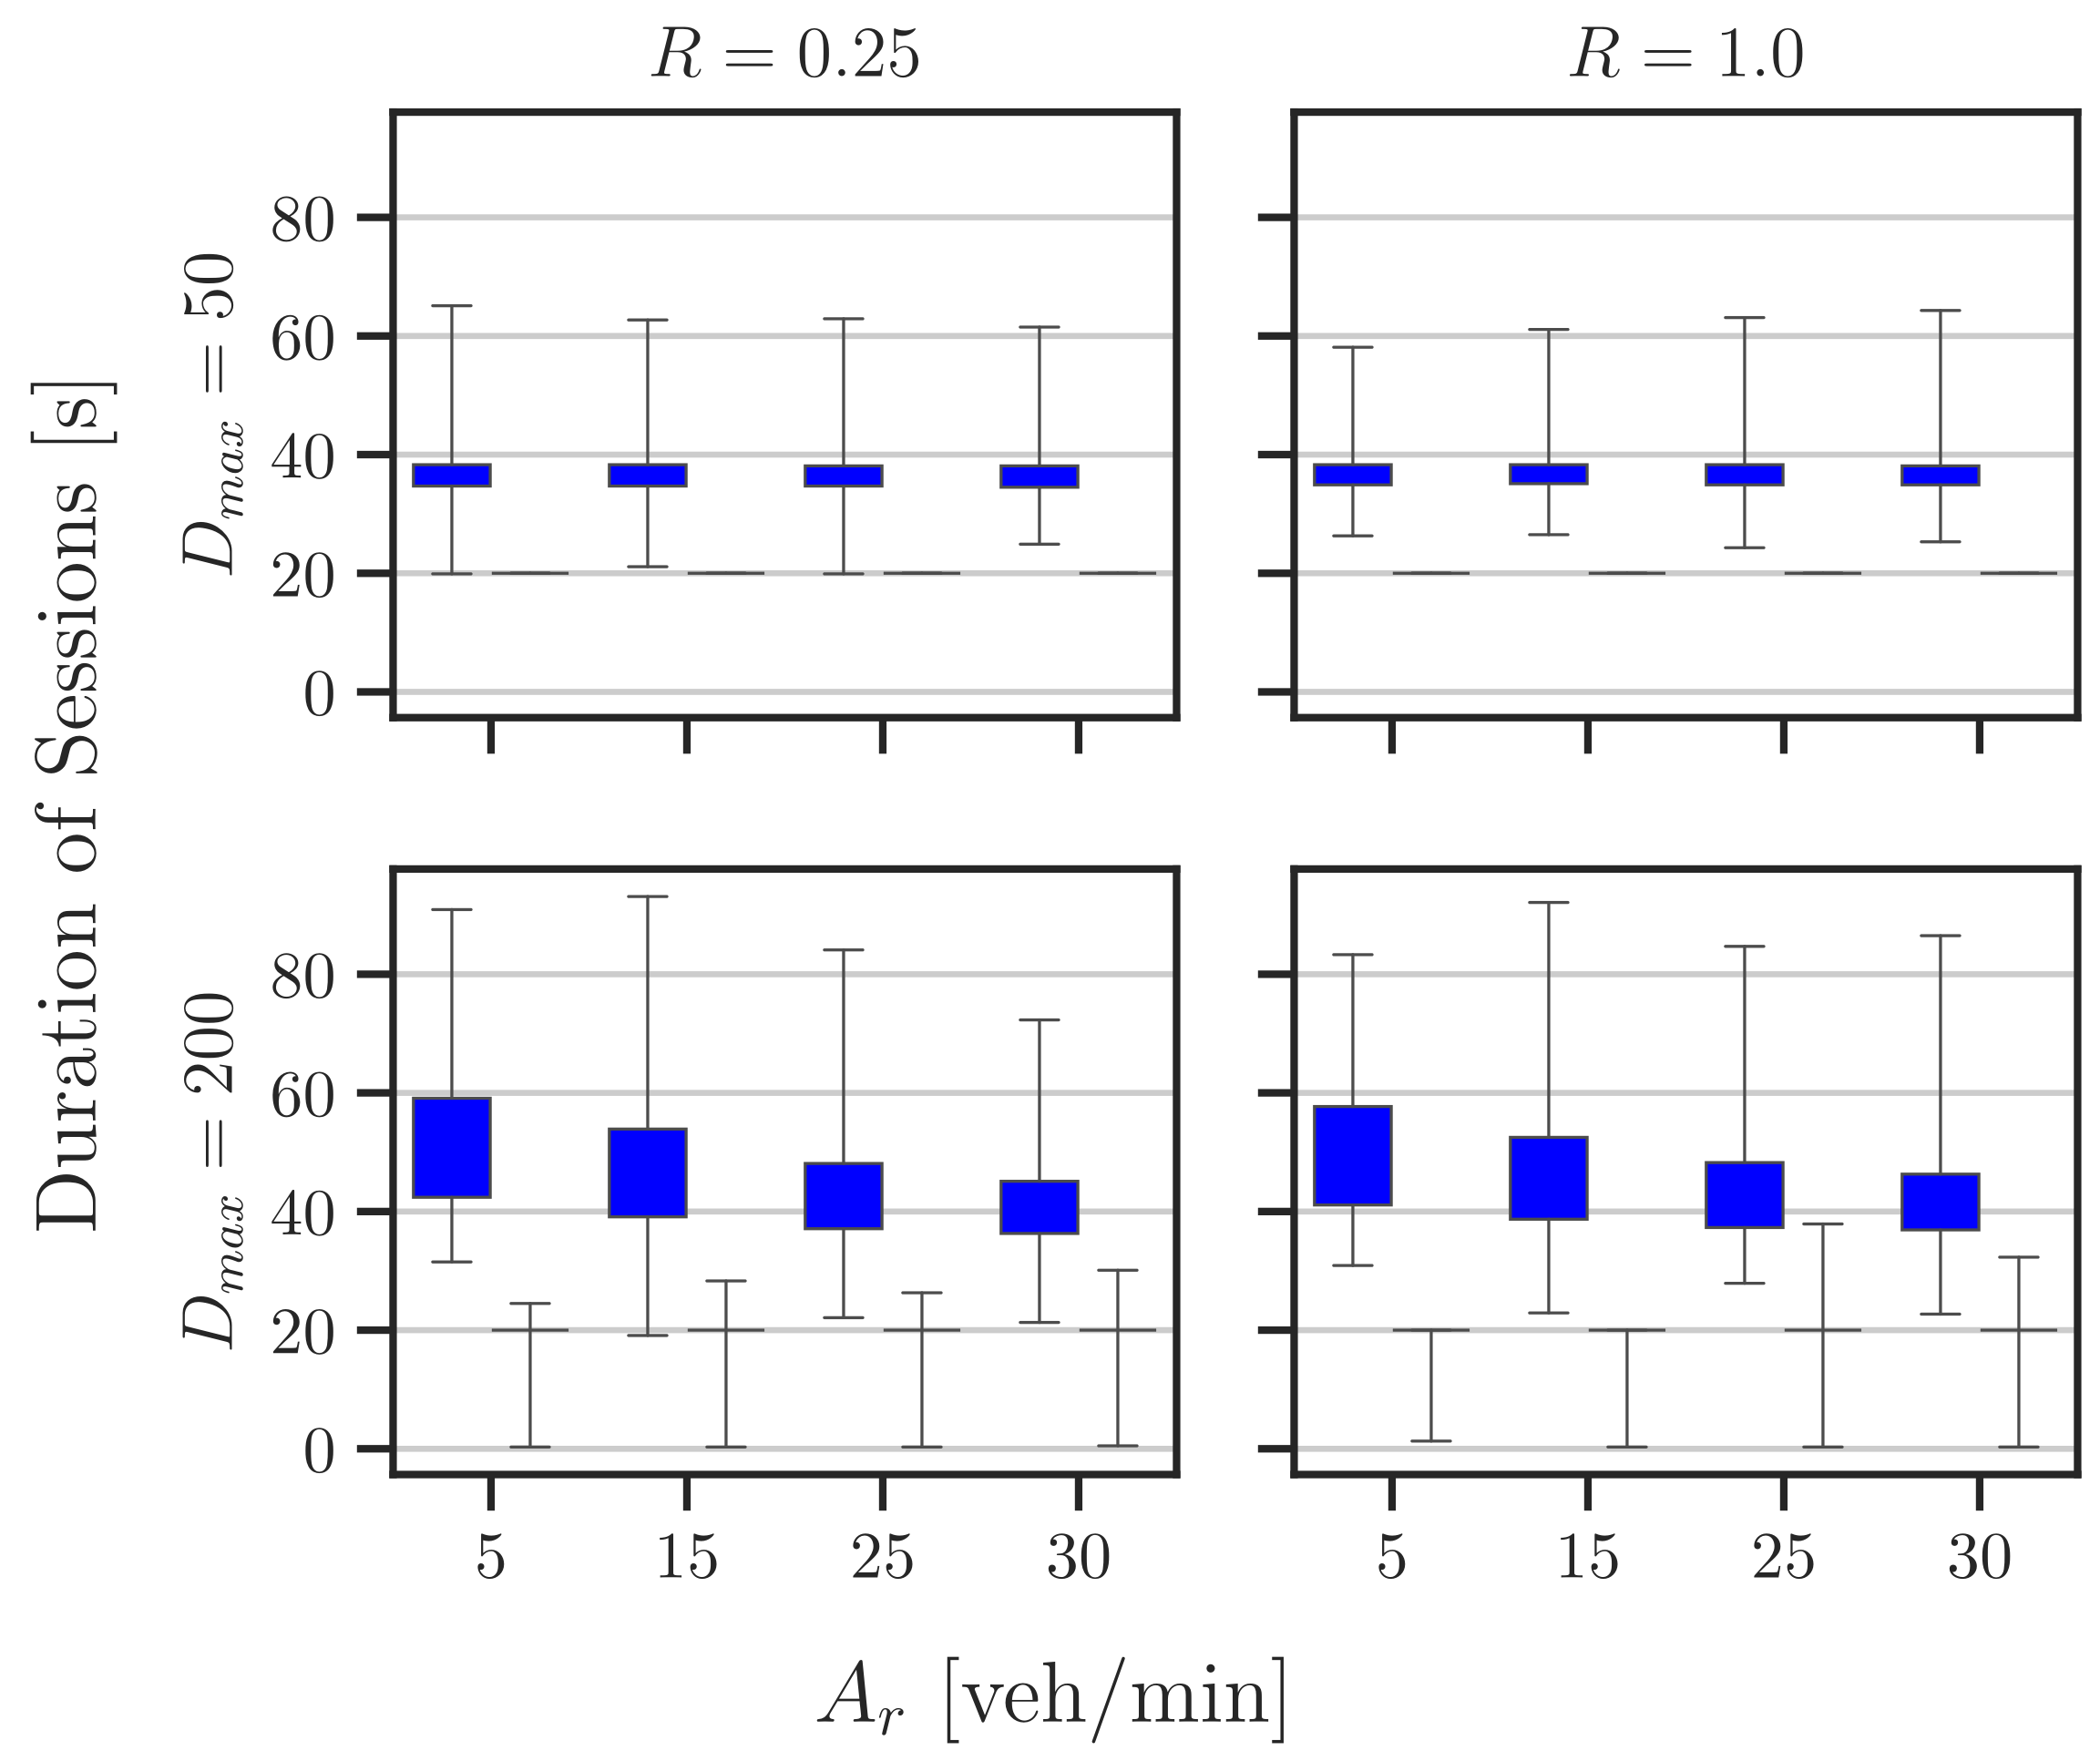
to generate the boxplots (reported below) about the number and the duration of successful/aborted platoform sessions.
 Counting the number of successful (blue), aborted (red), denied (gray) sessions across 4 different groups of experiments.
 Distribution of the duration of the same PlatoForm sessions counted in the above figure.